Optimize Mining and Processing Rates
These are some of the tools that can be used to influence the design and operation of AG/SAG Mills.
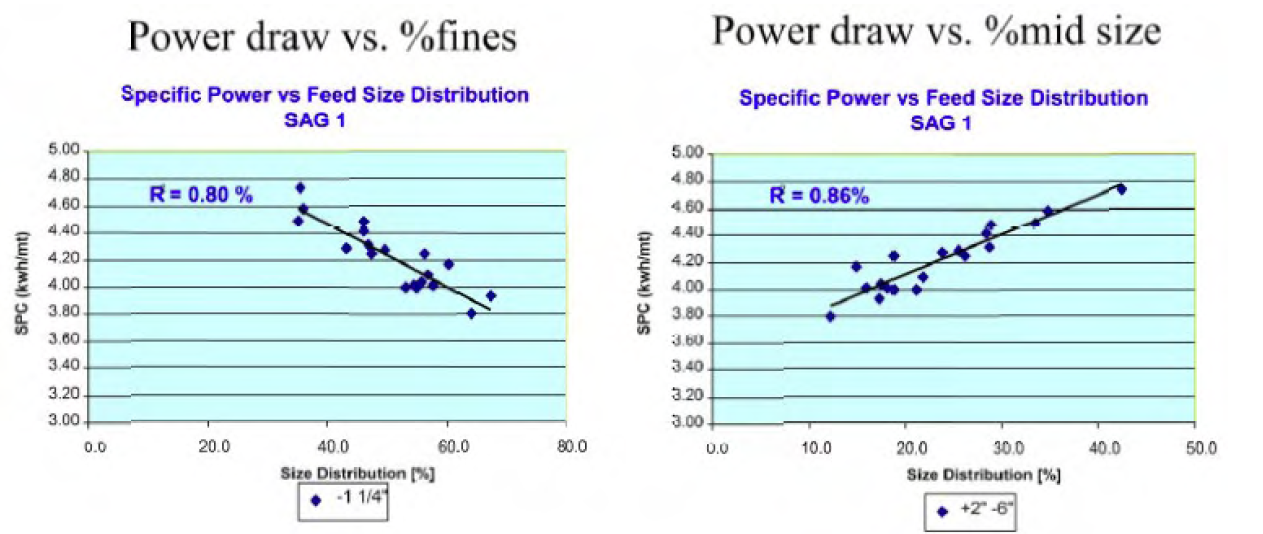
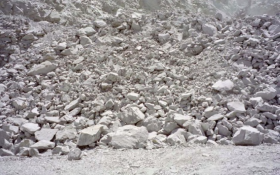
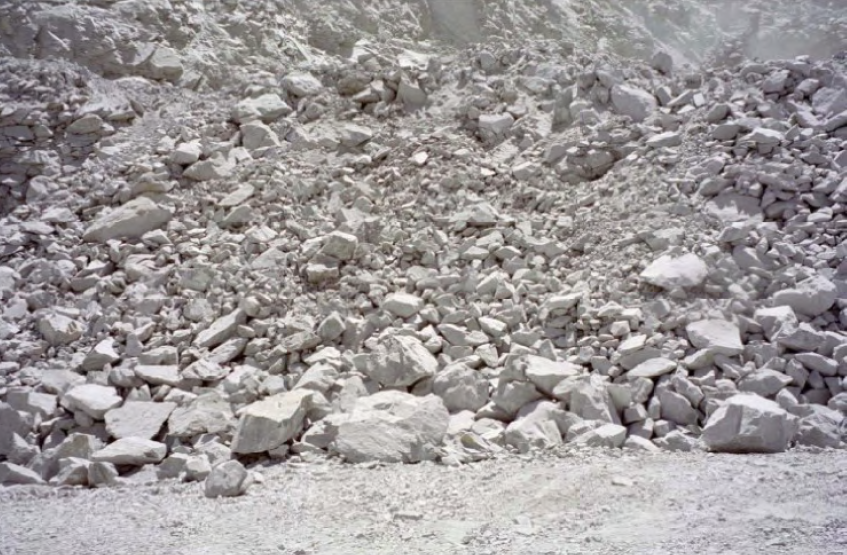
Optimizing Mill Feed Size
-
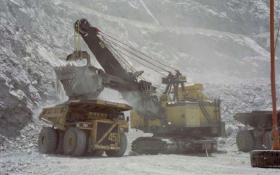
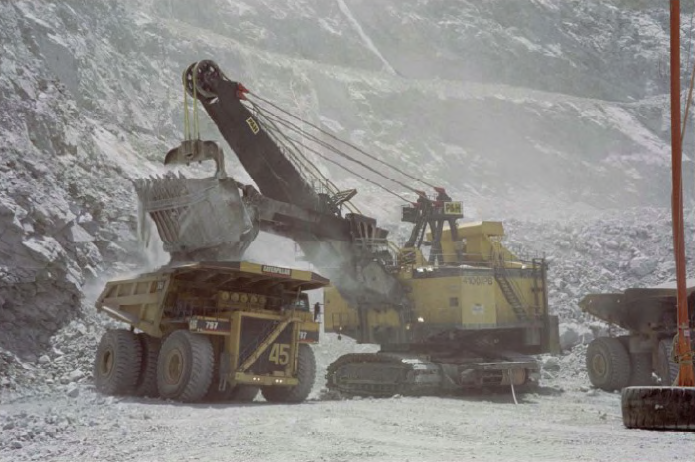
- Mine to Mill
-
- Mine to Mill
-
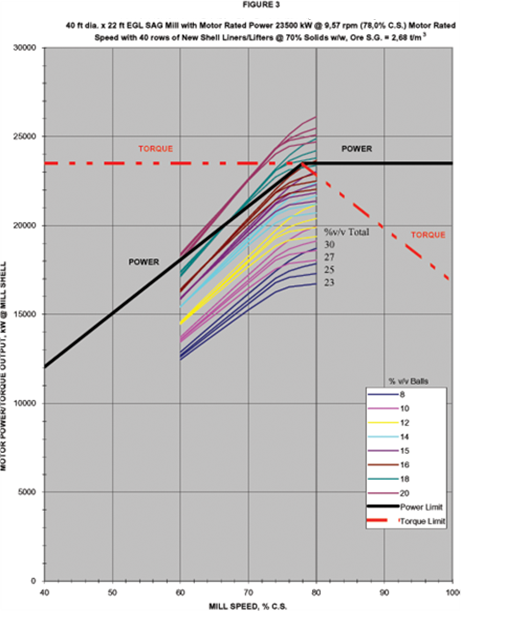
- SAG Mill: “Tent” Diagram: Higher Speed (Brodie, Barratt) – Predicted Operation
-
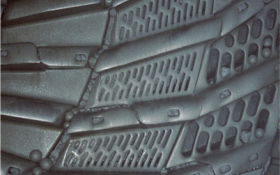
- SAG Mill Grate – Curved Bolt Pattern
Estimation of Preliminary Capital Costs
Preliminary CAPEX (Crushing, Grinding & HPGR Circuits)
- DEVELOPMENT OF BUDGET (±25 %) COST FOR PRINCIPAL EQUIPMENT LIST
- FACTORING
- INSTALLED COST + SITE COSTS TO TOTAL DIRECT COST
- CONSTRUCTION FACILITIES + EPCM TO TOTAL INDIRECT COST
- OWNER’S COST & CONTINGENCY TO TOTAL INITIAL CAPITAL COST
Estimation of Operating Cost Parameters
Preliminary OPEX (Crushing &Grinding)
- DEVELOPMENT OF SPECIFIC power consumption (kWh/t) FOR CRUSHING, PRIMARY & SECONDARY MILLING, AND TOTAL BY SAMPLE OR UGM.
- DEVELOPMENT OF BALL WEAR RATES (g/kWh) FOR PRIMARY & SECONDARY MILLING, AND TOTAL BY SAMPLE OR UGM FROM BOND Ai MEASUREMENTS AND DJB’s IN-HOUSE EMPIRICAL EQUATIONS.
- CALCULATION OF LINER, WEAR RATES (g/kWh) FOR CRUSHING, PRIMARY & SECONDARY MILLING, HPGR, AND TOTAL BY SAMPLE OR UGM FROM BOND Ai MEASUREMENTS AND DJB’s IN-HOUSE EMPIRICAL EQUATIONS.
- ADD ALLOWANCES AS PERCENTAGES FOR OPERATING & MAINTENANCE LABOUR.
Results Comparison
These charts show a range of application for different comminution flow-sheet protocols, as well as two project examples of one test protocol vs another.
-

- Comparison of Flowsheet Protocols

-

- Benchmarking – DJB & SPI Models

Matching Motor to Mill Operation
It is important to install sufficient motor power at its rated speed to cover the range of expected ore hardness vs mill throughput objectives. This chart shows that many SAG Mills are underpowered relative to possible maximum operating conditions.
Bench Marking Power for SAG Mills

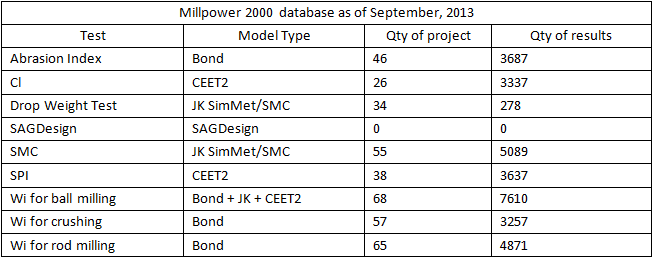
Simulation of Mill Sizing “Millpower2000”
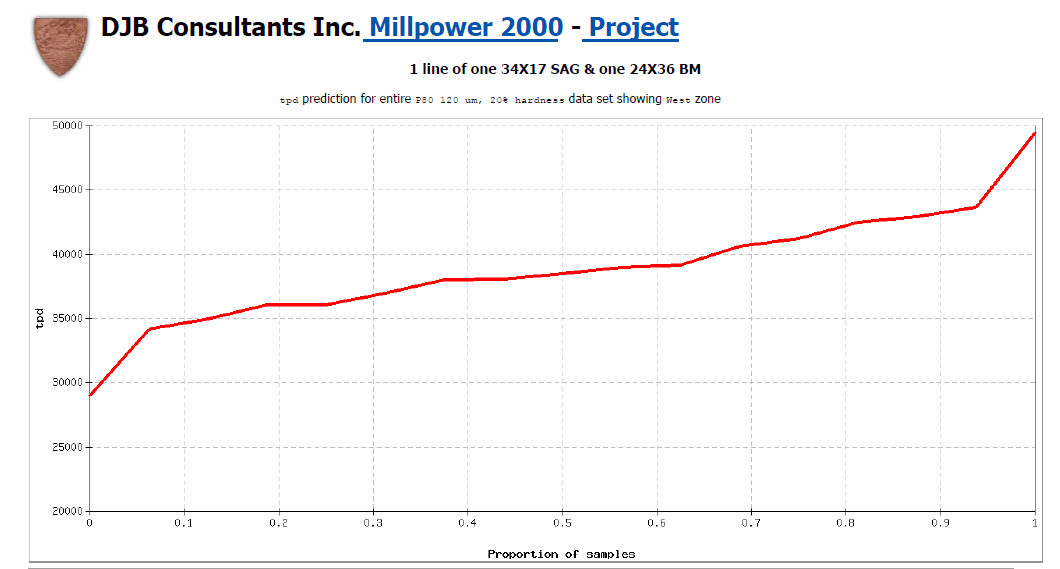
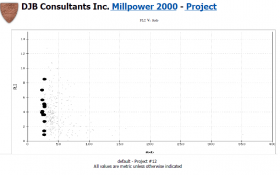
Comminution test results are entered into the “Millpower2000” database (please refer to the table) on a project basis for simulation. Different combinations of mill sizes, motor powers, and operating conditions can be simulated to assess ranges of mill throughput objectives and ore hardnesses on a “sample frequency” basis (please refer to the chart).
Ore Characterization
Objectives
- Geometallurgical variation (mine to mill)
- Economically predict specific power consumption and variation in an orebody
- Permit reduction in design allowances, or capture additional throughput in softer ores.
- Establish the necessity for Pre-Crushing or HPGR.
Testing Ore Composites
- Batch scale required for variability, simulation & design (ore dependent)
- Pilot scale required for autogenous grinding, design (ore dependent) & model calibration.
Tests and Models
Calculation & Methodology
Selection of a ‘Design Point’ on the chart will define the required motor powers for the grinding circuit to process hard to soft ore types, consistent with a range of mill throughput within the Payback period and future potential for an expansion which would be determined from entry of data into the mine block model.
Specific Energy Requirement and Design
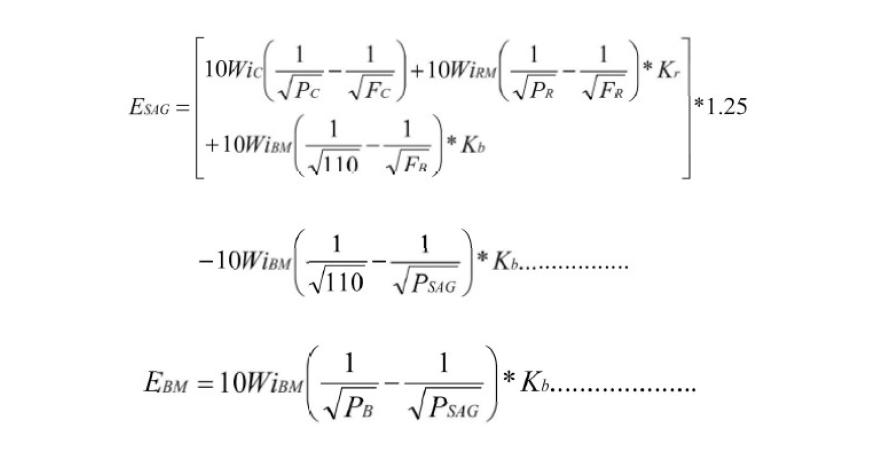
These equations form the Basis of DJB’s “Millpower2000” Simulation Program for estimating power requirements and mill sizes vs mill throughput objectives. It is an iterative process, but the software can accommodate a large number of geo-comminution samples in a time-efficient manner.
Basic Equations
Empirical Formula (Barratt)
Overall Power Requirement, ASAG Circuit (1979)
Modified power requirement based on El Teniente Surveys (1986)
EBM= (ESSBM * -ESAG) + Contingency (1986)
With a Bond Work index-based Phantom Cyclone Approach (1989)
*ESSBM for secondary/tertiary crushing and single-stage ball milling (Rowland, 1982)
Net power for AG/SAG mills
kW (net) = PN * ρ * D2.5 * L
Legend
PN = power number*
ρ = mill charge density (Loveday, 1979)
D = diameter (net effective inside shell liners/lifters)
L = effective grinding length (inside feed end and grate discharge liners along the mill shell)
*Based on contact (1986-1987) with:
– Highland Valley Copper (Lornex), Afton, Island Copper & Similkameen and update (1992-1993) with:
– Kennecott (Copperton)
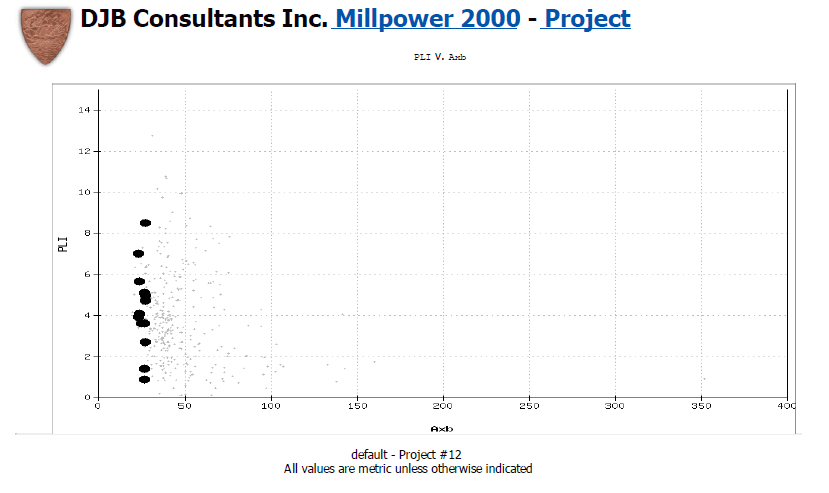
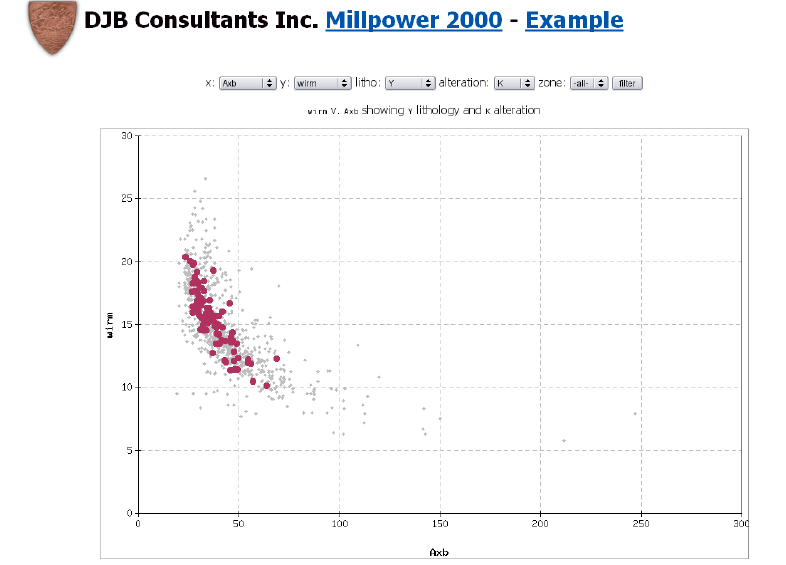
Assessment of Comminution Test Results
It is important to examine comminution test results on a “parameter vs. parameter” basis vs. petrographical texture and DJB’s Millpower2000 database.
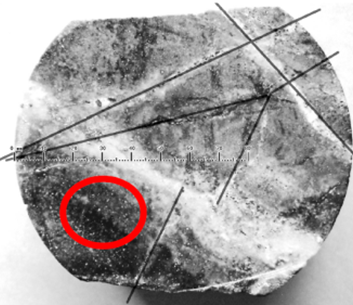
Comminution Fracture Analysis
Coarse test measures strength of the fractures.
• PQ core highlighting planes of weakness.
Medium test measures strength of the inter-fracture matrix.
• Fractures are typically 20-50mm apart.
-
- Millpower 2000 Data Base Comparison Example
-
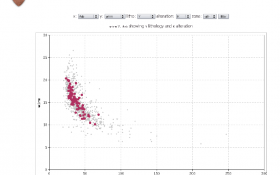
- Millpower 2000 Data Base Comparison Example
QA / QC
Some test protocols are more amenable to particular ore types, whereas other protocols are amenable to most ore types.
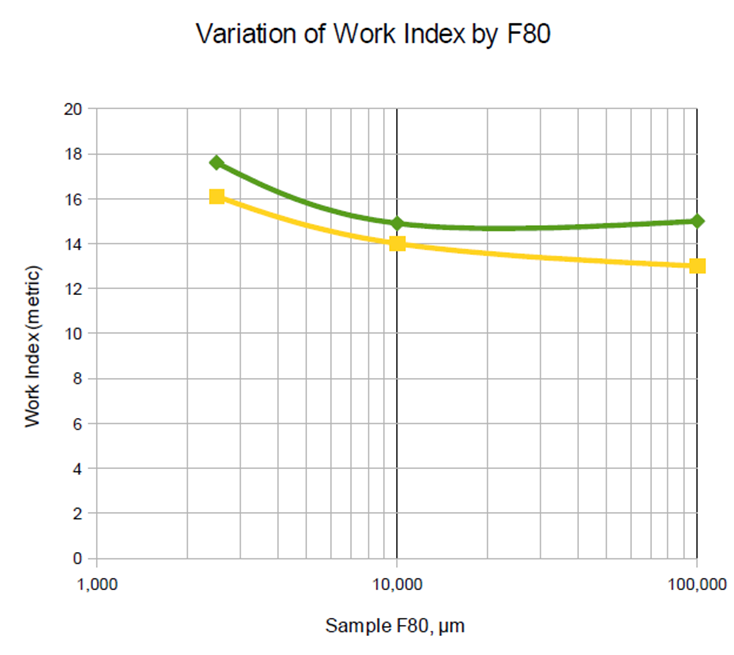
Breaking Energy by Size
Homogenous ores show consistent and predicable behaviour over a range of sizes.
(eg., SMC, DWI)
Other models use discontinuous size bands rather than continuous functions.
(eg., Millpower 2000, CEET)
-
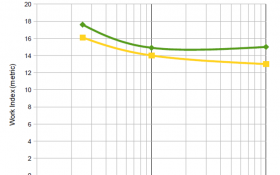
- Homogenous Ores
-
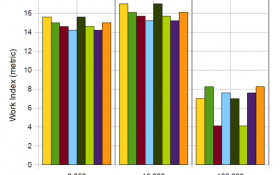
- Heterogeneous Ores
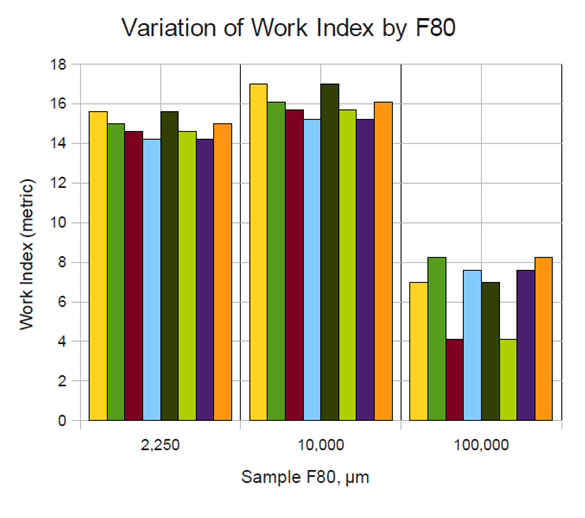
Both examples use 3 size bands.
Third-Party Monitoring of Comminution Test Protocols
This is considered to be important, not only to check on laboratory procedures, but also to check on the test equipment standards.
- Review laboratory practice and reporting vs specifications for test work (e.g., limiting mesh)
- Review cardinal parameters vs DJB database (e.g., g/rev)